The Vacancy in Visibility
Picture this: You’re the VP of Finance for a growing hospitality group. Nine properties across the Southeast. Each one with its own PMS, its own revenue streams, its own way of tracking performance. And when ownership asks “What’s our RevPAR across the portfolio?"—you need a week to pull the numbers together.
That was Orlando Co’s reality.
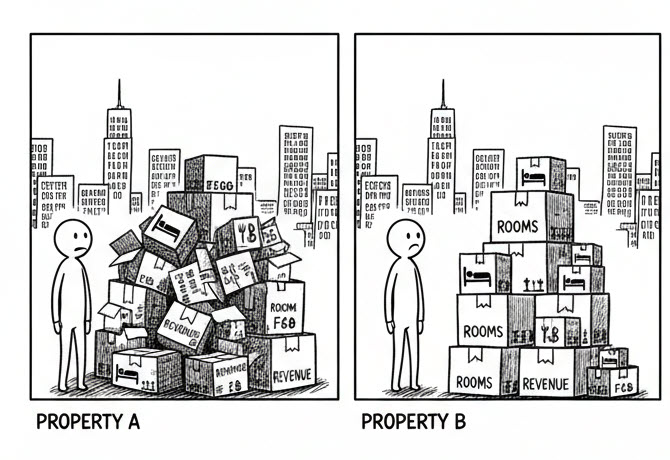
They’d grown through acquisition, picking up boutique hotels and conference centers along the way. Each property came with its own systems, its own chart of accounts, its own definition of “revenue.” Now they had a portfolio that looked successful on paper but couldn’t answer basic questions about performance.
They were stuck.
We knew some properties were carrying others. We just couldn’t prove which ones—or why.
That’s the kind of blind spot we walked into. This wasn’t about pretty dashboards. This was about making investment decisions with real data.
The Problem Beneath the Surface
When we sat down with Angela from Corporate Finance and James from Operations, the scope of the challenge became clear. It wasn’t just about consolidation. The problems ran deep:
The Multi-Property Nightmare
- Each property used different revenue categories
- F&B revenue mixed with room revenue in some properties
- No standardized cost allocation for shared services
The Revenue Recognition Maze
- Advance deposits that weren’t properly matched to stays
- Group bookings with complex billing arrangements
- Loyalty program redemptions creating accounting headaches
The Performance Measurement Dilemma
- KPIs calculated differently at each property
- Comp sets that weren’t truly comparable
- No way to benchmark properties against each other fairly
As Angela put it: “Every property manager tells me they’re outperforming. They can’t all be right, but I can’t prove who’s wrong.”
The existing system just wasn’t built for this complexity.
Enter the Creators
This is where Bish and Bhavana stepped in.
Their approach wasn't to throw technology at the problem. It was to understand it first. Hours of calls. Property visits. Questions like "What happens when a guest moves their reservation between properties?" and "Walk me through how you calculate GOP."
The Key Insight
The breakthrough came when we realized the core issue: Orlando Co didn't need more reports. They needed standardized reports, with consistent definitions, enabling fair comparisons.
Bhavana proposed a three-pronged approach:
- Unified Revenue Taxonomy mapping all properties to standard categories
- Consistent KPI Calculations using industry-standard formulas
- Portfolio-Level Views with drill-down to individual properties
No more apples-to-oranges comparisons. No more property managers gaming their metrics.


The Proposed Solution
We invoked the 5 Standards of the Report Factory:
1. ETL Plumbing
Solidifying the data pipeline from D365 F&O to Microsoft Fabric. Revenue data, operational metrics, and financial transactions—all flowing into one place.
2. Data Modeling
A single source of truth. One data model that standardized revenue categories across all properties. We built custom views to calculate KPIs consistently regardless of source system.
3. Visual Hierarchy
Flyovers for ownership who need portfolio summaries. Drill-downs for property managers who need their specific details. Everyone sees what they need to see.
4. Maintenance
Systems that can be managed even if outsourced. Documentation. Standards. Repeatability. No platform lock-in.
5. Portability
Architecture that can be moved between platforms without losing functionality.
The Transformation
We finally had the data to make a decision we’d been putting off for two years. One property was dragging down the whole portfolio.
Here’s what changed:
Before:
- 9 properties, 9 different performance stories
- KPIs that couldn’t be compared across properties
- Portfolio decisions based on incomplete data
- No visibility into true property-level profitability
After:
- Unified revenue reporting across all properties
- Consistent KPI calculations enabling fair benchmarking
- Real-time portfolio performance visibility
- Property-level P&L with standardized cost allocations
The moment of truth came during their quarterly ownership meeting. Angela presented portfolio performance with drill-downs into any property. James’s reaction?
“For the first time, we could see which properties were actually performing and which ones were just good at explaining away their numbers.”
That’s the sound of clarity replacing confusion.
The Bigger Picture
What Orlando Co taught us goes beyond reporting. It’s about the future of how hospitality groups operate.
As Joe shared during one of our sessions:
I don’t think there’s going to be a reporting department in the future. What’s going to happen is that people will write an operating system that runs the business. And reporting is just for the AI agents, it’s just for the operating system.
The materiality of stopping and thinking—of pausing to look at printouts and decide what to do—is a massive cost to any organization. Orlando Co’s transformation is a step toward a future where the right information flows to the right decisions automatically.
Your Turn
Orlando Co’s journey from stuck to unstuck took weeks, not months. The investment was measured in thousands, not hundreds of thousands.
Every organization has a story. What’s yours?
Are you:
- Struggling to compare performance across properties?
- Drowning in inconsistent revenue definitions?
- Making portfolio decisions without reliable data?
The water might be rising. But you don’t have to stay stuck.