The Inventory Iceberg
Picture this: You’re the COO of a regional distribution company. Four distribution centers serving hundreds of retail locations. Thousands of SKUs. And when someone asks “Do we have enough of Product X for the holiday season?"—three people give three different answers.
That was Oklahoma City Co’s reality.
They’d grown fast, acquiring smaller distributors and inheriting their systems along the way. Now they had four DCs running on different processes, inventory counts that never reconciled, and a purchasing team buying based on gut feel rather than data. Meanwhile, cash was tied up in slow-moving inventory while fast movers kept stocking out.
They were stuck.
We had $2 million in dead stock and kept running out of our best sellers. That’s not a data problem—that’s an existential problem.
That’s the kind of crisis we walked into. This wasn’t about reports. This was about cash flow and customer retention.
The Problem Beneath the Surface
When we sat down with Denise from Purchasing and Kevin from Operations, the scope of the challenge became clear. It wasn’t just about counting inventory. The problems ran deep:
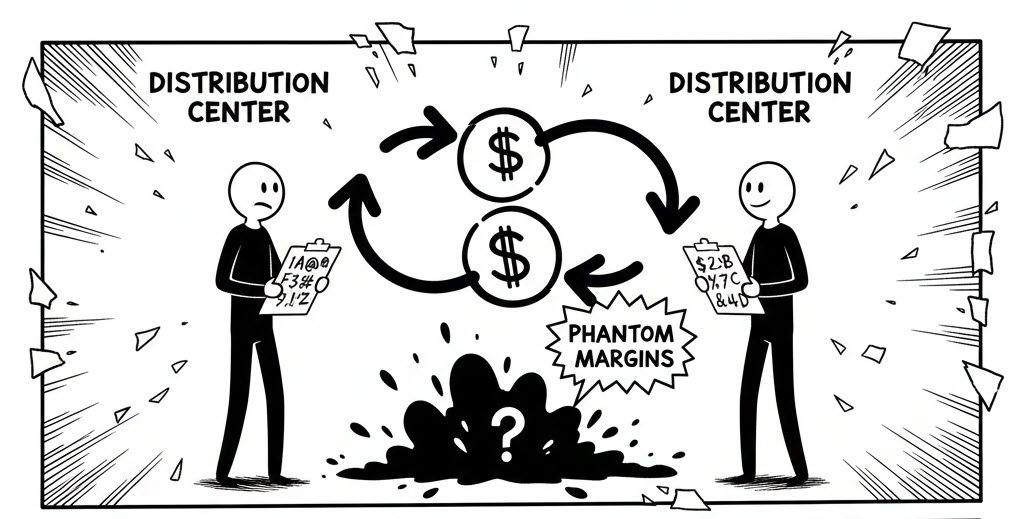
The Multi-DC Nightmare
- Each DC had different item numbering conventions
- Transfer pricing between DCs created phantom margins
- No consolidated view of total inventory position
The Margin Erosion Maze
- Customer-specific pricing that wasn’t tracked at the transaction level
- Rebates and allowances buried in separate spreadsheets
- No visibility into true landed cost by product
The Demand Planning Dilemma
- Historical sales data that didn’t account for stockouts
- Seasonality patterns lost in aggregated numbers
- No way to see velocity by location
As Denise put it: “I’m supposed to plan purchases for next quarter, but I don’t even know what we actually sold last quarter versus what we could have sold.”
The existing system just wasn’t built for this complexity.
Enter the Creators
This is where Bish and Bhavana stepped in.
Their approach wasn't to throw technology at the problem. It was to understand it first. Hours of calls. DC visits. Questions like "What happens when a customer order spans multiple DCs?" and "Walk me through how you decide what to reorder."
The Key Insight
The breakthrough came when we realized the core issue: Oklahoma City Co didn't need more reports. They needed actionable reports, showing true margins and real demand signals.
Bhavana proposed a three-pronged approach:
- Unified Inventory View across all DCs with standardized item mapping
- True Margin Analysis including all rebates, allowances, and landed costs
- Demand Intelligence accounting for stockouts and seasonality
No more guessing at inventory levels. No more hidden margin erosion.


The Proposed Solution
We invoked the 5 Standards of the Report Factory:
1. ETL Plumbing
Solidifying the data pipeline from D365 F&O to Microsoft Fabric. Inventory, sales, purchasing, and rebate data—all flowing into one place.
2. Data Modeling
A single source of truth. One data model that unified items across all DCs. We built custom views to calculate true landed cost and margin at the transaction level.
3. Visual Hierarchy
Flyovers for executives who need inventory health summaries. Drill-downs for buyers who need SKU-level details. Everyone sees what they need to see.
4. Maintenance
Systems that can be managed even if outsourced. Documentation. Standards. Repeatability. No platform lock-in.
5. Portability
Architecture that can be moved between platforms without losing functionality.
The Transformation
We identified $400K in dead stock to liquidate and freed up cash to stock what actually sells. Best ROI we’ve ever seen.
Here’s what changed:
Before:
- 4 DCs, 4 different inventory pictures
- Margin analysis that missed rebates and allowances
- Purchasing decisions based on incomplete demand data
- Stockouts on fast movers, overstock on slow movers
After:
- Unified inventory visibility across all locations
- True margin analysis including all cost components
- Demand forecasting that accounts for lost sales
- Inventory optimization reducing carrying costs
The moment of truth came when they ran their first true margin report. Kevin’s reaction?
“We had customers we thought were profitable that were actually costing us money. And customers we’d been neglecting that were our best accounts.”
That’s the sound of seeing the business clearly for the first time.
The Bigger Picture
What Oklahoma City Co taught us goes beyond reporting. It’s about the future of how distributors operate.
As Joe shared during one of our sessions:
I don’t think there’s going to be a reporting department in the future. What’s going to happen is that people will write an operating system that runs the business. And reporting is just for the AI agents, it’s just for the operating system.
The materiality of stopping and thinking—of pausing to look at printouts and decide what to do—is a massive cost to any organization. Oklahoma City Co’s transformation is a step toward a future where the right information flows to the right decisions automatically.
Your Turn
Oklahoma City Co’s journey from stuck to unstuck took weeks, not months. The investment was measured in thousands, not hundreds of thousands.
Every organization has a story. What’s yours?
Are you:
- Drowning in inventory complexity across locations?
- Struggling with margins that don’t match expectations?
- Making purchasing decisions without real demand data?
The water might be rising. But you don’t have to stay stuck.